Getting Started
Welcome
What is RepurposeDrugs?
RepurposeDrugs (https://repurposedrugs.org) is a user-friendly web tool designed to streamline the process of drug repositioning for both single and combination therapies across a diverse range of diseases. It serves as an interactive web application that enables users to explore and visualize extensive drug and drug combination-disease associations, including those from approved, investigational, and failed trials, to facilitate the identification of novel therapeutic uses. Along with comprehensive exploration portal, the tool features an innovative machine learning model that predicts drug-disease associations and their approval likelihoods for any user-provided compound. Overall, RepurposeDrugs is an integrative database for both single-agent and combination therapies, featuring an ML-based web tool for predicting the likelihood of treatment approval. Unlike conventional drug repurposing databases, it covers a broad range of diseases and a variety of both single drugs and combinations, opening new avenues for researchers and clinicians seeking innovative therapeutic solutions.
Portal Overview
The platform boasts an extensive database covering 25 disease categories, 4,314 monotherapies and 161 drug combinations, collectively contributing to a vast repository of 28,148 drug-disease associations, providing a rich resource for researchers.
| Approved | Failed | Investigational | Predicted | |
|---|---|---|---|---|
| Single Agents | ||||
| # Drugs | 382 | 409 | 4187 | 1356 |
| Diseases/Conditions | 190 | 175 | 1669 | 167 |
| Drug-indication associations | 656 | 1088 | 26,112 | 8,700 |
| Drug Combinations | ||||
| # Drug combinations | 65 | 62 | 34 | 204 |
| Diseases/Conditions | 55 | 39 | 85 | 90 |
| Drug-indication associations | 70 | 62 | 160 | 578 |
Statistics for approved, terminated (failed), investigational and predicted drug-indications. The top three rows, presented in black text, show statistics for single drug-indication associations, whereas the bottom three rows (highlighted in blue) are for drug combinations within RepurposeDrugs.
RepurposeDrugs allows users to input drug SMILES, enabling customized drug repurposing potential predictions. The underlying algorithm is trained on known approved/failed indications and capable of predicting disease association scores for a broad spectrum of user-provided compounds, regardless of their development stage. For more details see: [to be filled]

RepurposeDrugs prediction workflow consists of three main steps. Left panel: Manual curation of datasets, integrating drug/disease identifiers, primary targets, structural information, and disease categorization. Middle panel: Model training and testing, highlighting feature extraction from drug and disease descriptors. Right panel: New drug-disease associations predictions, employing a conformal prediction approach to exclude low-confidence predictions.
Usage Guide
RepurposeDrugs can be accessed through https://repurposedrugs.org. Upon arriving at the site, users will find a navigation tab at the top center of the screen, providing access to information on both compounds and combinations.
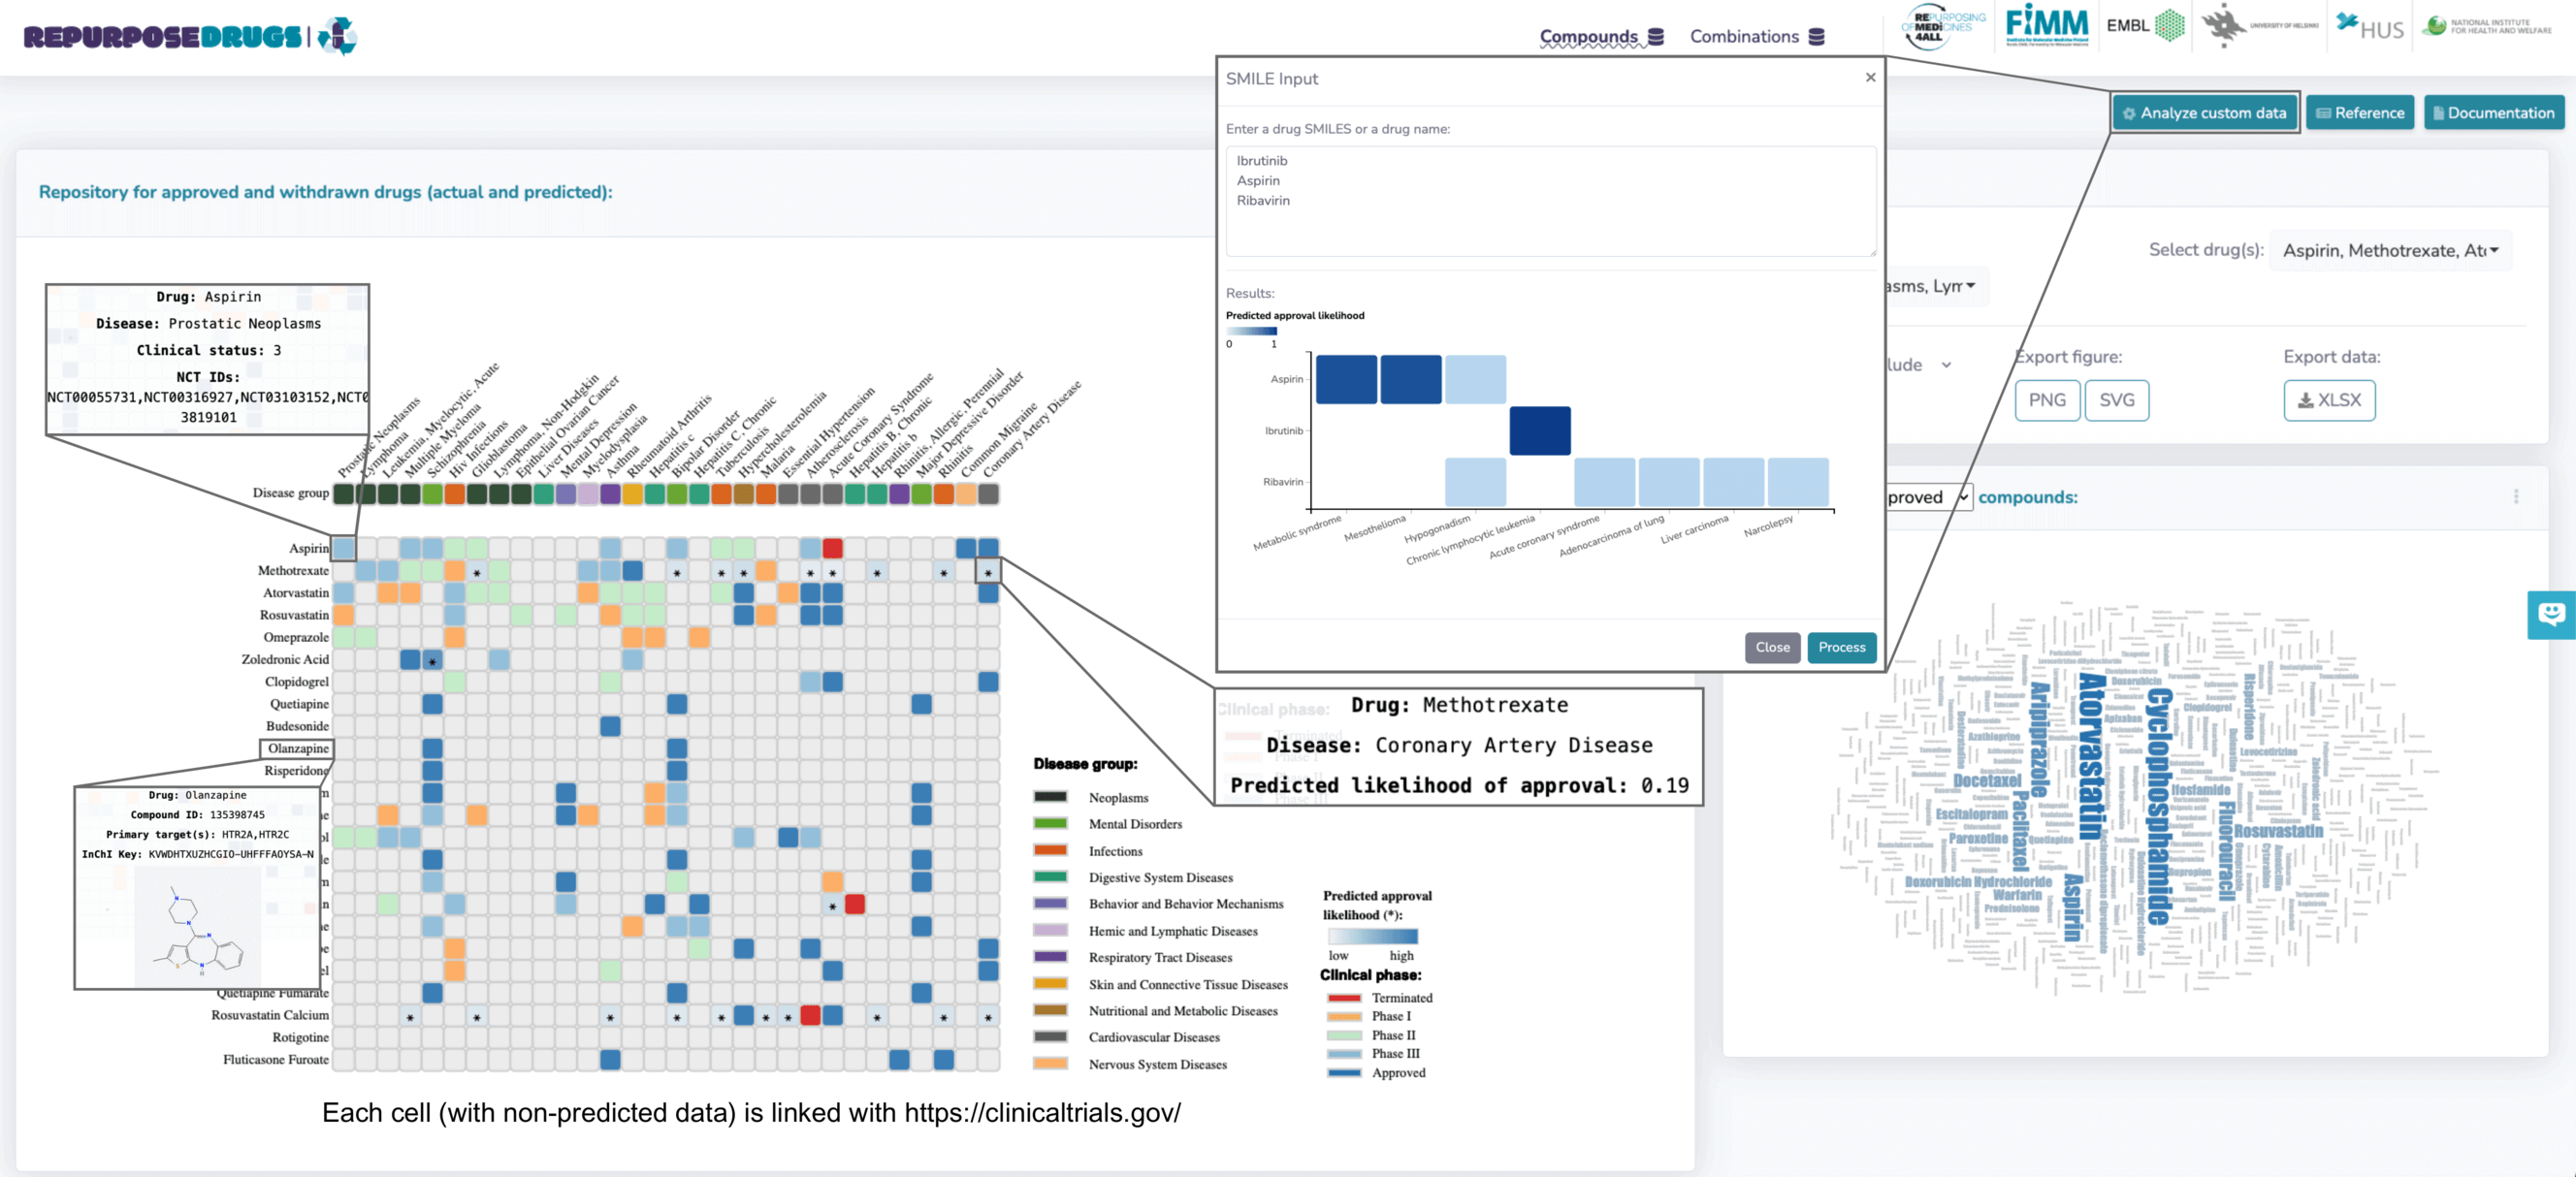
Interactive HeatmapThe central feature is an interactive heatmap that displays the clinical phase achieved by each compound or combination and their predicted approval likelihood, as assessed by the RepurposeDrugs machine learning model. This information is conveyed with a clear color-coded system, each marked with an asterisk for distinct clarity. Hovering over heatmap entries reveals intricate details like drug structure, targets, PubChem ID, InChIKey, as well as the clinical status of the drug-disease pair and its predicted approval likelihood. In the figure below, for example, placing the cursor over the drug panel, such as Olanzapine, displays information specific to that drug. However, hovering over a colored section that intersects drugs and diseases, like Aspirin-Prostatic neoplasm, provides insights on using aspirin for Prostatic Neoplasm, its clinical phase (Phase 3), and NCT IDs. Entries marked with an asterisk include additional information about the predicted likelihood of approval. For instance, the entry for the methotrexate-coronary artery disease association, marked with an asterisk, shows a predicted approval of 0.19. It's noteworthy that not all entries have predicted values, as conformal prediction excludes low-quality predictions. Clicking on an unmarked entry in the heatmap redirects users to the corresponding clinicaltrials.gov page.
Analyzing Custom DataRepurposeDrugs notably allows users to analyze custom data, by either inputting drug name or SMILES. Inputting drugs like ibrutinib, aspirin, and ribavirin enables visualization and comparison of their predicted approval likelihoods for different diseases. For instance, ibrutinib has a high predicted approval likelihood (1) for treating chronic lymphocytic leukemia. Ribavirin, an antiviral for RSV infections, shows a low approval likelihood (0.19) in lung adenocarcinoma treatment.

Personalized Searches in RepurposeDrugs
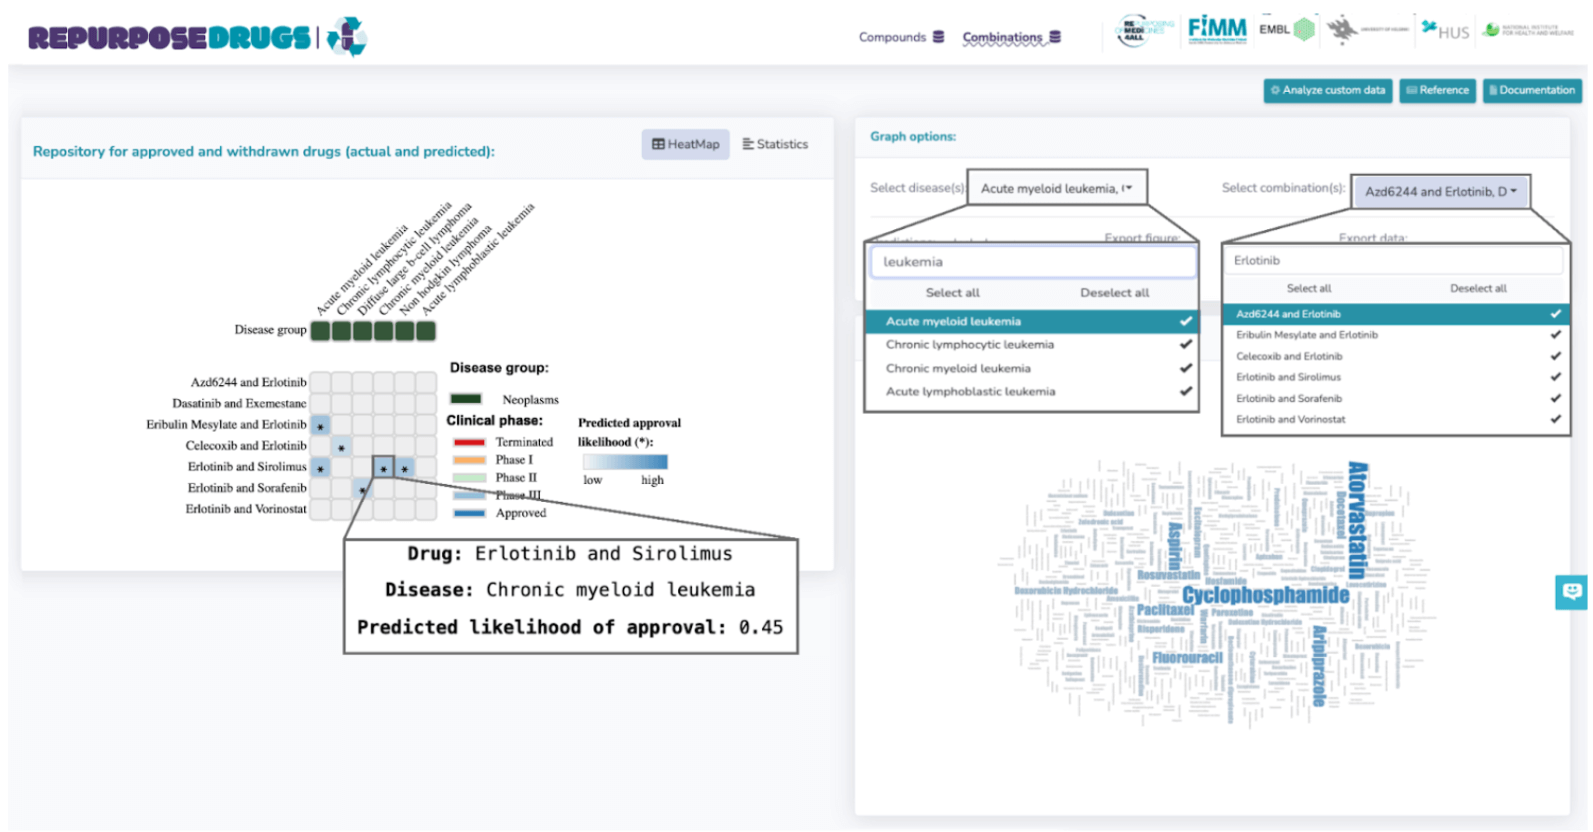
The portal supports personalized searches, enabling users to tailor their queries by filtering for specific diseases and drugs, which dynamically updates the heatmap. These customizations can be performed via the 'Graph Options' panel, situated to the right of the heatmap. To demonstrate, consider the example of exploring combination therapies for leukemia or lymphoma. This process starts by refining the disease selection in the 'Select Disease' dropdown under Graph Options, selecting only those associated with "leukemia" or "lymphoma". This can be easily done by typing the keyword, resulting in 6 relevant diseases. The focus then shifts to combinations involving Erlotinib, a tyrosine kinase receptor used in non-small cell lung cancer and advanced pancreatic cancer treatment, or Dasatinib, a kinase inhibitor for certain leukemia types. This is achieved by specifying in the 'Select Combinations' tab under Graph Options and typing in the specified area. This narrowed search results in 7 drug combinations. Figure below illustrates the results for this query, highlighting the predicted likelihood of approval for using Erlotinib and Sirolimus in chronic myeloid leukemia treatment (0.45).

Statistical plots
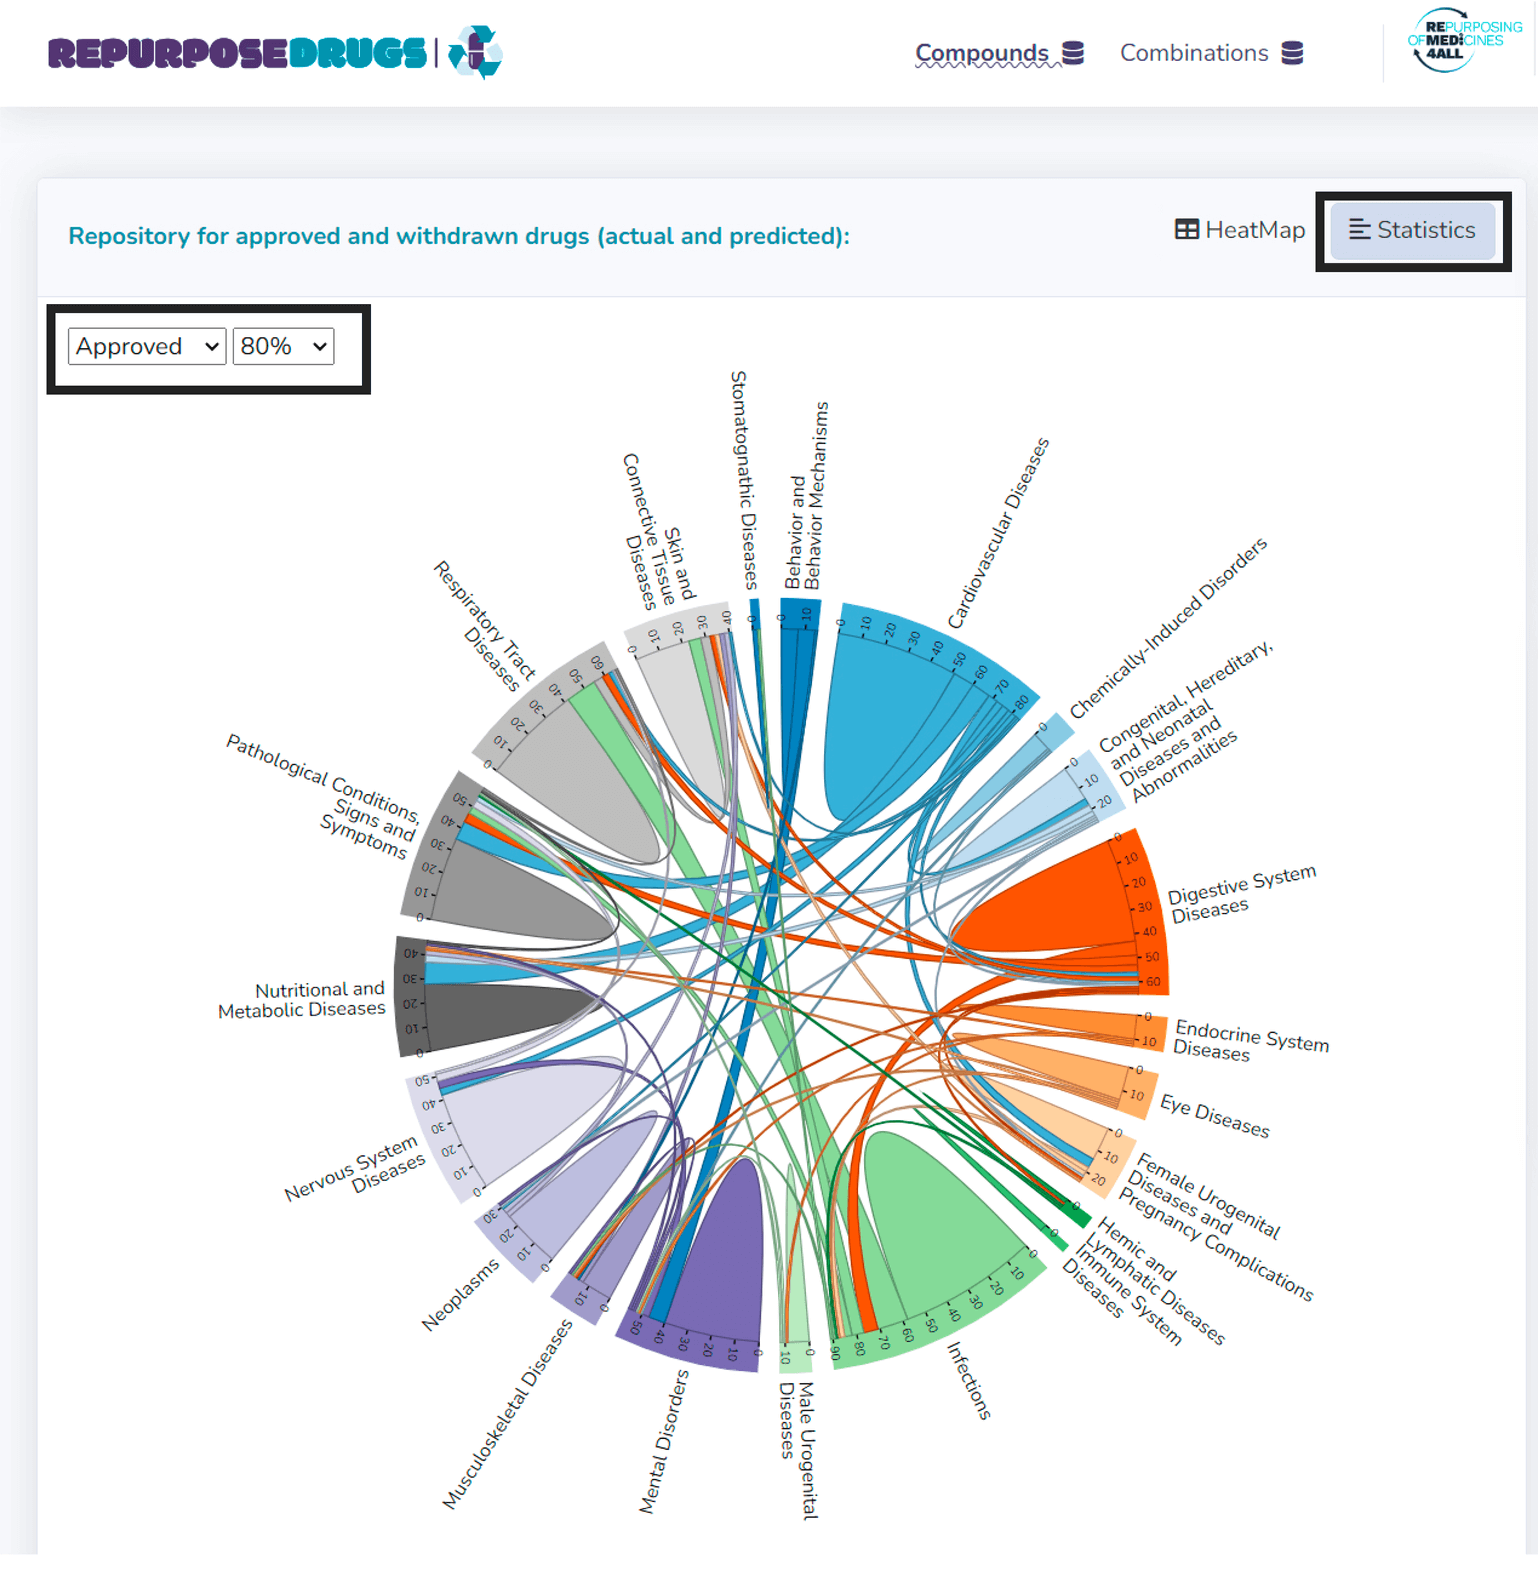
RepurposeDrugs also feature interactive chord plots, available through Statistics tab, which highlight the overlap of shared drugs between approved or failed indications across different disease groups. The dropdown menus on the left side provide options for switching between statistics of approved and terminated drugs, as well as for adjusting the figure font size. An interactive exploration is available through hovering over disease group names.

These visualizations offer valuable insights for future drug repurposing research, suggesting the potential cross-applicability of drugs between certain disease groups.
Another key visualization is a word cloud plot that showcases drugs with the highest number of approved or terminated disease indications, providing a quick visual reference to identify trends in drug development.

Data Export
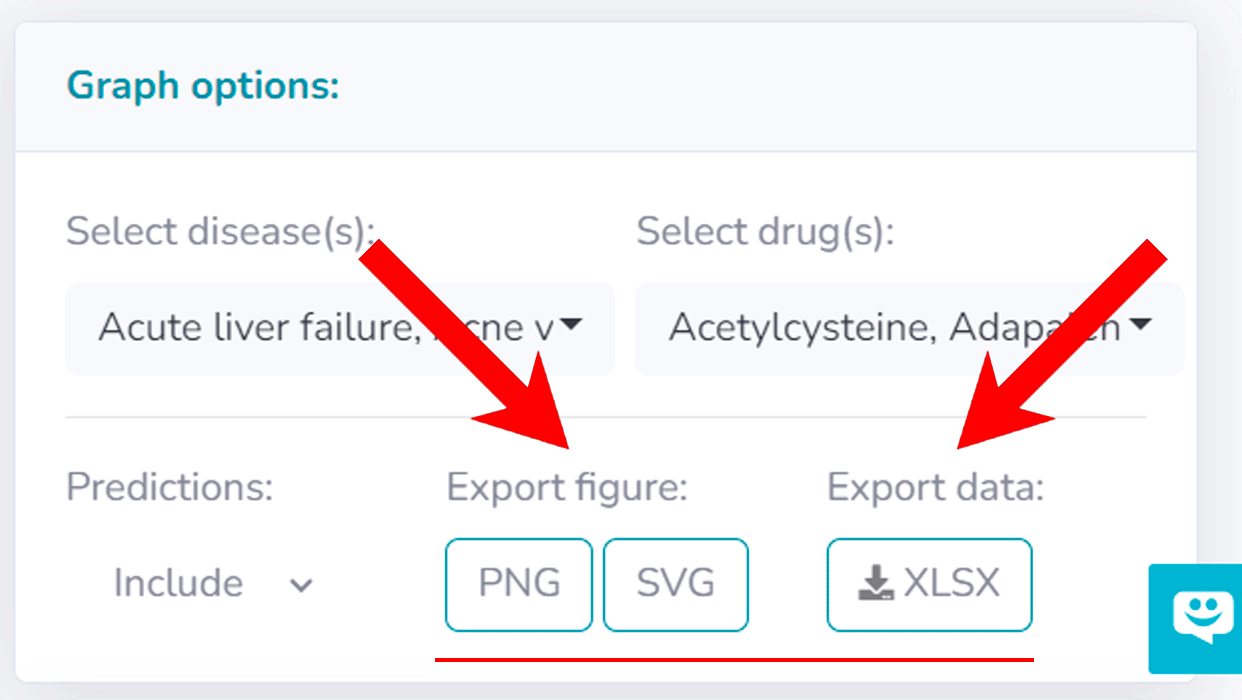
RepurposeDrugs platform provides various export features. Major visualizations (heatmaps and chord diagrams) can be easily downloaded by selecting the "PNG" or "SVG" buttons (refer to the figure below). Likewise, the underlying data for both single-drug and drug combination heatmaps is accessible in XLSX format through the 'Export Data XLSX' button.

Additionaly, supportive visualizations (e.g. word-cloud plot) can be exported by clicking the three dots located in the top right corner of the figure box.
Feedback
We encourage users to propose enhancements or raise issues through the provided feedback button on the right side of the web tool.
License
The RepurposeDrugs is released under the GNU General Public License, version 3.